NJH.PORTFOLIO
AUTOMATED HYDROPHONE
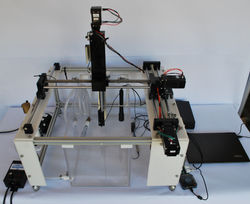
For my senior project, I, along with two other students, developed a therapeutic ultrasound device testing apparatus called The Automated Hydrophone. The purpose of the apparatus was to automatically map the intensity of an ultrasound beam with minimal input or manual operation from a user, and output the data graphically and in an organized manner. I accomplish motion in 3 axes, measurements at a frequency on the order of 10 MHz, as well as processing and representation with programming in LabVIEW. I designed a PCB in Eagle for the break out of DAQ pins to peripheral components. I created tests to measure the effect of directivity on the hydrophone and implemented tests for linear actuators and hydrophone specifications. I designed frame and tank structures, and modeled and maintained the entire design in SolidWorks. We completed the project with a budget of $14,291, compared to benchmarked commercially available product costing $100,000.

MECHANICAL DESIGN AND CAD
I was tasked with designing the tank frame, vibration isolation, and gantry mounting. I modeled most components in CAD to verify spacial layouts and mounting patterns. I also managed assemblies, adding and mating any newly created parts outside the ones I designed. From conceptual models to the final prototype, our CAD was versioned by me.
PCB BOARD DESIGN
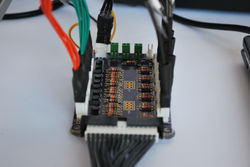
To measure frequencies at the ultrasonic frequency regime (10MHz), we needed oscilloscope capabilities, so we went with Digilent's Analog Discovery 2. Although the BNC adapter allowed access to the scope and trigger siganls, the rest of the pins, mostly general I/O, were carried further along a ribbon cable. To access ribbon cable pins, I designed a breakout board to interface with motor drivers, limit switches, E-stop, and indicator light, as well as unused I/O pins.


CODE
The Analog Discovery 2 was able to be programmed in LabVIEW although it had limited support as it wasn't an official National Instruments device. Since nothing had to happen rapidly, an RTOS system was not necessary. I implemented the entire system as a large state machine, diagrams for which are below. The basic function was to present the user with a GUI to gather info for the desired scan, home the device, run the scan, then save the data to be viewed later. I also implemented a viewer GUI to view previous scan files, as heat maps of intensity, peak and RMS pressure fluctuation values.
STATE MACHINE DIAGRAMS
 |  |  |
|---|---|---|
 |  |  |
 |  |